Archive for category Data and Statistics
Interest rates rise: what does it mean for you?
Posted by thunsicker in Data and Statistics, Uncategorized on February 22, 2018
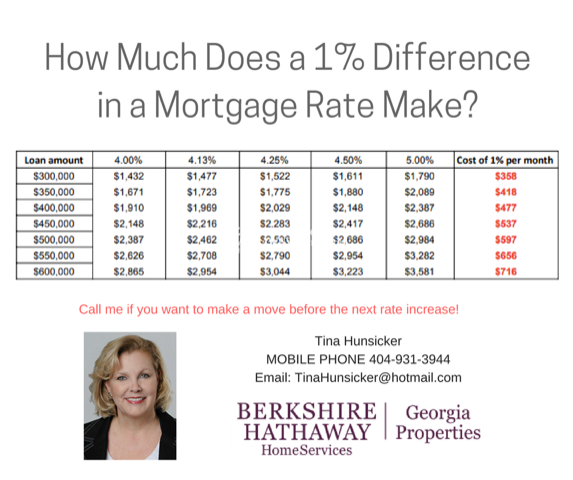
Rates are going up and now is a better time to buy than any other time this year. Here’s what the anticipated interest rate increases mean in terms of monthly mortgage payments.
We don’t expect any softening in values, so the rate increase means you’ll be able to buy less house. I’m up to date on what you can get at many price points and can help you buy quickly.
Berkshire Hathaway’s January Market Report for Buckhead
Posted by thunsicker in Buckhead, Data and Statistics, Uncategorized on February 9, 2018

Berkshire Hathaway has released its Buckhead real estate market update for January 2018 and it looks like 2018 was off to a slow start. However, I believe it is related to the weather we experienced here and not the demand. I do see activity picking up in February and a sense of urgency with the threat of higher interest rates on the horizon.
We have basically 3 markets going on right now. If a buyer is looking under $500,000 they can be prepared for a bidding war with multiple offers on properties that are priced right. That’s particularly true in the under $350k price range. Buyers that are looking from $500k-$1.5M can expect an even balance of buyers and sellers and should expect to pay comparable pricing to last year with little increase in pricing. The buyers in the over $2M price range are in a buyers market and should expect to get deals. There is about 4 years of inventory out there and plenty to pick from. These buyers may have a high cash percentage as a down payment but due to the higher price points they are particularly sensitive to interest rate increases.
As always, your home is unique and as such requires an expert to help you price. Hitting the range at the right price will help you sell in a reasonable amount of time. I pride myself on my recommendations, not that all of my clients take them, but I’m confident in the analysis and getting your home sold rapidly if it is within the range. We are ready to help you take the most advantage of this upcoming Spring market!
Please feel free to reach out with any questions!
November Real Estate Update for Vinings and Buckhead
Posted by thunsicker in Atlanta Real Estate, Data and Statistics, State of Real Estate Market on November 11, 2015
October real estate transaction volume is down in Vinings and Bulkhead, but not as severely as it was in September and August which was dramatically down month over month and year over year.
Vinings numbers are somewhat misleading as the transaction volume has been so low that percentages don’t seem relevant. The most notable thing to me was that the average sales price was under $800k, which says the main things selling are pretty close to lot prices, not so much resales.
In Buckhead, sales were down 14% year over year and 8% month over month. Buckhead is a much bigger market, so its most likely a seasonal dip in sales and a lack of inventory in the year over year sales.
September Market Update – Vinings, Buckhead and Smyrna
Posted by thunsicker in Buckhead, Data and Statistics, State of Real Estate Market, Vinings on October 17, 2013
Generally, Vinings is its own unique market. Our sales in September remained the same as a year ago and down 44% from last month, while inventories went up slightly. Days on Market went way down. I believe is because many buyers are patiently waiting for the right house to pop up, and when it does, they grab it. If you don’t get your buyer in the first couple of weeks, it may be on market a while as the inventory has remained somewhat stable or slightly higher in Vinings. We don’t seem to have the shortage of supply that Buckhead has, but our area is so much smaller that the right house at the right price can be hard to find.
And on to the Buckhead market: We didn’t see a big change from September to October, but year to year the news is still good. Days on Market is down 31% from last year and available listings are down 28%. Compared to the previous month, sales in September were down, but can be expected at this time of year. We are seeing the return of the trade-up buyer. Confidence in their ability to sell their current home is again allowing buyers to take that step to a bigger home. This is a change in the “downsizing” trend we saw while the economy was down. There is still a 4 year Inventory over $2M, so that market is still slow, but the $1M-$2M market is better than it has been.
Even though my blog is titled Real Vinings Buckhead, I’ve decided to add information on Smyrna as well. I’ve sold so many homes there recently and currently have several available listings there. It’s always interesting to me how different all three of these markets are. Buckhead, by definition, is a much larger geographic area and has many more high priced homes. Because of this, its numbers are highly affected by the luxury homes market and the more “average” homes – which happen to range around $600,000 – still fly off the market. In Vinings (30339,) the homes average closer to the $500,000 range with two lots selling at that price in the past month as well. Existing inventory is primarily the original 1960’s homes (both original and remodeled) and newer construction that ranges well over $1M.
The Smyrna market, on the other hand, was much more affordable with the average over the past year being around $300,000. This year we are seeing the higher priced homes in Smyrna coming back on the market and selling. Because of this, the affordably priced homes are eaten up and the higher priced homes are driving the price point up causing a drop in the volume of transactions. I’ve seen homes in the $500,000 range get snatched up over the past few months, where a year ago I could count on one hand the number of homes in Smyrna that sold over $500,000. I should add that these reports are for 30080 Smyrna, and not Mableton per se. The statistics back me up with the sales in Smyrna being down 14% year over year and down 26% month to month. As always, please contact me with any questions you have about buying or selling your home.
Feature for Sellers: Prudential monthly real estate updates
Posted by thunsicker in Buckhead, Data and Statistics, State of Real Estate Market, Vinings on September 16, 2013
Knowing what is going on in the real estate market is just as important when selling your home as it is when you are buying. One of the great features that has come with joining Prudential is a monthly market update that is quick and concise. Below, I’ve included links to the Buckhead and Vinings September updates.
What you’ll notice in the Buckhead data is the dramatic fall off of sales in August. Normally, I would think this drop is related to back to school, but this year the decrease was more dramatic than in years past.
Vinings was more stable from July to August. I believe the uptick in sales prices is related to the Jumbo rates being lower than conventional financing right now. In both markets you’ll see that inventory is down dramatically.
If you are interested, I’m happy to pull YTD data for you as well. As always, if you’re thinking about selling, give me a call so I can help you analyze the value of your home.
3.8% Tax: What’s True, What’s Not
Posted by thunsicker in Data and Statistics on December 6, 2012
I want to provide some true data here as it relates to sales tax and purchasing or selling a home.
I have received several emails where people thought there was a Federal Sales tax going into effect which is attached to the new Health Care Reform bill as a way to pay for Obamacare.
First off, there is NO such thing as a Federal Sales tax. Period. Ever. All federal monies are recieved via the IRS and our annual filing of forms.
Here are some articles that explain what is really happening. For 90% of sellers there will be no impact as you have a personal residence exclusion to capital gains (if by chance you have a gain!), but investors need to pay attention and read the following articles carefully.
 From the National Association of REALTORS®
The 3.8% Tax and Health Care Reform
3.8% Tax: What’s True, What’s Not
 From Politifact
Truth-O-Meter Pants on Fire
Buckhead (30327) real estate market update: June 2012
Posted by thunsicker in Buckhead, Data and Statistics, State of Real Estate Market on July 25, 2012
The market trend is continuing that we see in the Vinings market into the Buckhead real estate market as well. Decreasing inventory and rising sales with the average selling price going up!
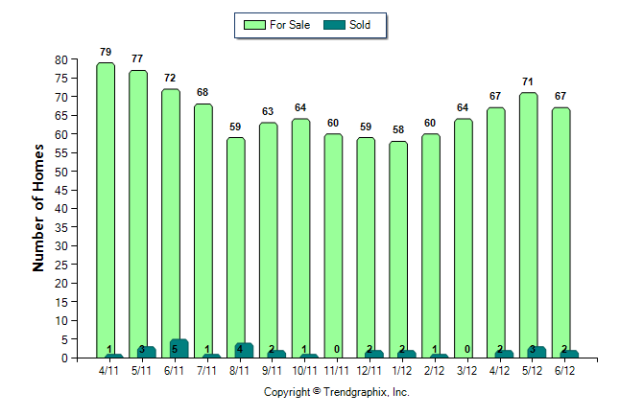
Within the $200,000 to $650,000 price point, sales have been steadily increasing and we’re in multiple offer situations quite frequently. Inventory is trending downward again with sales continuing up. Good news for all!
The stats are slightly improved in 30327 from $400,000 and up and it looks like inventory and sales increased slightly. Year over year numbers show improvements, but I think this could vary with an analysis of a tighter price point.
Finally I had a fellow agent say to me the other day that she thought luxury sales were up. I think we’re seeing things under $2,000,000 continue to sell well, but over $2M it still remains soft. Inventory remains high and prices continue to soften within the luxury market. Of course, this pie can be sliced in various ways, but I just wanted to pull data a few different ways to see if what I feel in the market is what is happening statistically. If you’d like me to pull some data specific to your price point and area, just email me and I’ll do a custom report for you.
Number of Homes For Sale vs. Sold (Apr. 2011 – Jun. 2012)
Buckhead/Atlanta – 30327
Price Point – $200,000 to $650,000
Number of Homes For Sale vs. Sold (Apr. 2011 – Jun. 2012)
Buckhead/Atlanta – 30327
Price Point – $400,000 and up
Number of Homes For Sale vs. Sold (Apr. 2011 – Jun. 2012)
Buckhead/Atlanta – 30327
Price Point – $2,000,000 and up
Vinings (30339) real estate market update: June 2012
Posted by thunsicker in Data and Statistics, State of Real Estate Market, Vinings on July 25, 2012
Interesting data again about what we’re seeing in the Vinings real estate market – the area of Atlanta in zip code 30339.
Inventory is down with sales on the rise, across all price points! At the $300,000 price point this reflects what I have personally seen in the market and continues the trend from last November. The higher price point in Vinings is finally having steady sales after next to nothing in 2011. These statistics look more dramatic due to the low volume, but it is positive news!
Number of Homes For Sale vs. Sold (Apr. 2011 – Jun. 2012)
Vinings, Georgia – Zip Code 30339
Price Point – $300,000 and up
Number of Homes For Sale vs. Sold (Apr. 2011 – Jun. 2012)
Vinings, Georgia – Zip Code 30339
Price Point – $800,000 and up
Buckhead (30327) real estate market update: February 2012
Posted by thunsicker in Buckhead, Data and Statistics, State of Real Estate Market on February 16, 2012
The market trend is continuing that we see in the Vinings market into the Buckhead real estate market as well.
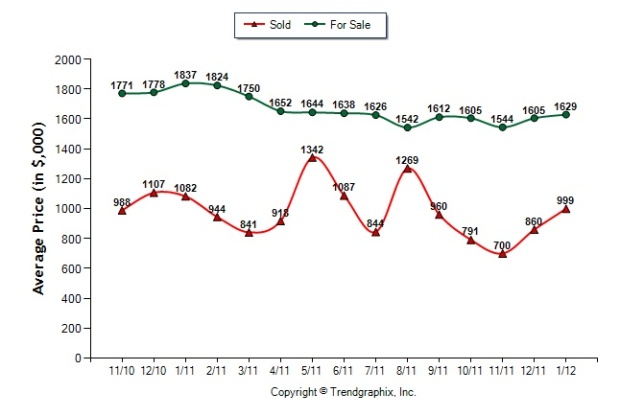
Decreasing inventory, average selling price is going up which is good considering the inventory is priced higher than what the buyers are looking for.
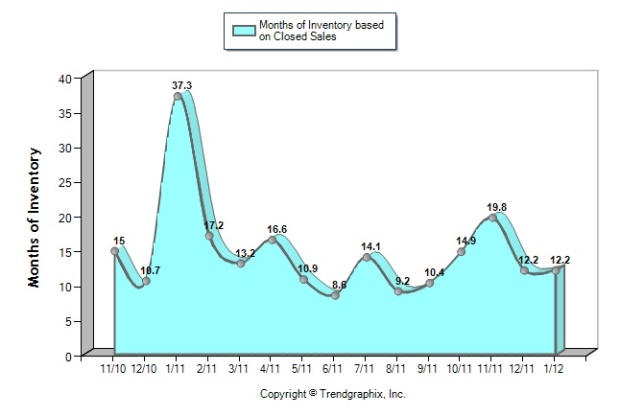
We remain steady at a year of inventory in Buckhead. If this trend continues we’ll be approaching a change in the dynamics of the market.
I had a conversation with an appraiser yesterday to figure out how we’re going to bridge the gap at what buyers perceive the value at and what the appraisers will appraise for. His comment is that the homeowners are going to need to take the risk to purchase over appraised value as the banks will not.
So the only way to reverse this trend is for cash buyers to put more cash into the transaction. We’ll see how this plays out over the next several months.
I’m a half full kind of person, so I hope this positive trend continues despite the national news!
Number of Homes For Sale vs. Sold (Nov. 2010 – Jan. 2012)
Buckhead/Atlanta – 30327
Average Price of For Sale and Sold (Nov. 2010 – Jan. 2012)
Buckhead/Atlanta – 30327
Months of Inventory Based on Closed Sales (Nov. 2010 – Jan. 2012)
Buckhead/Atlanta – 30327

